
Impact Of Irregularity And Strehl Ratio On Aspheric Lens Performance
By Cory Boone, Technical Marketing Manager, Edmund Optics
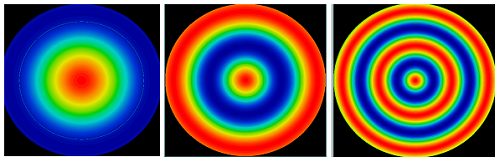
Aspheric lenses use complex, aspheric surfaces to correct for the spherical aberrations inherent to conventional spherical lenses (Figure 1). This allows aspheres to have smaller focal spots than other types of lenses. In addition to improving system resolutions, multiple spherical lenses can sometimes be replaced with a single asphere and achieve comparable performance, reducing system size and weight.

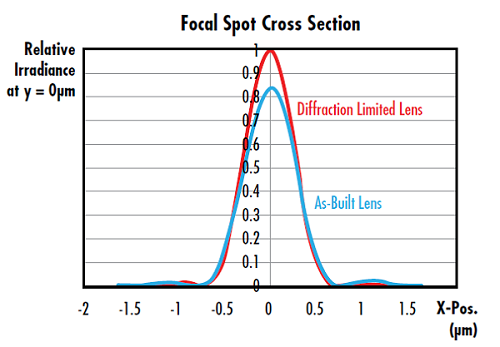
Every optical system has a performance limit dictated by the physics of light known as the diffraction limit. The system's Strehl ratio describes how its real performance compares to its diffraction-limited performance. The Strehl ratio for aspheric lenses and other focusing optics is given by the ratio of peak focal spot irradiance of the real lens to its theoretical, diffraction-limited peak irradiance (Figure 2).1 Different manufacturing methods for aspheric each impart unique surface errors that impact the lens' Strehl ratio in different ways. A knowledge of Strehl ratio and these effects is a powerful tool for correctly specifying aspheres, preventing costly and unnecessary overspecification, and making sure that desired performance levels are achieved. These concerns become increasingly important for fast aspheres with small f/#'s. Aspheres manufactured through conventional grinding and polishing are also more sensitive to manufacturing-dependent surface errors than aspheres made through other methods. The maximum achievable Strehl ratio is 1 and the industry standard threshold to characterize a lens as “diffraction-limited” is a Strehl ratio larger than 0.8.
Strehl ratio can also be approximately related to the lens' root mean square (RMS) transmitted wavefront error by the following equation, where σ is RMS wavefront error in waves.2 This approximation is valid when transmitted wavefront error values <0.2 waves.3

How Surface Irregularity Affects Strehl Ratio
An optic's Strehl ratio dependent on its surface irregularity, or the optical surface's deviation from its ideal form. The manufacturing method used has a large impact on surface irregularity. Conventional spherical lenses are usually polished using an oversized tool that imparts low spatial frequency errors on the optical surface during polishing. Asphere manufacturing, on the other hand, usually involves subaperture grinding and polishing, which results in a more complex surface irregularity structure. Understanding the connection between a surface irregularity specification and its underlying structure provides insight into the lens' Strehl ratio and real-world performance.
Consider the impact of the spatial frequency of the irregularity. Surface irregularity is commonly modeled as a rotationally-symmetric cosine function, so the resulting Strehl ratio can be described as a function of RMS surface irregularity for a variety of cosine periods (Figure 3 and Figure 4).
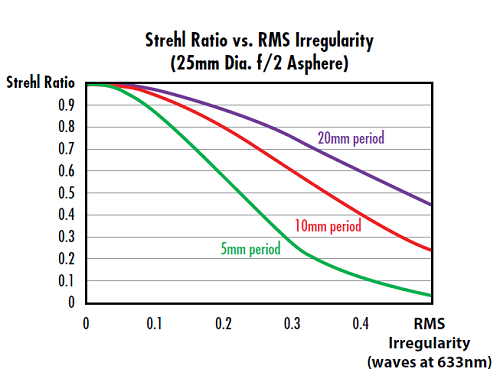
The key parameter to consider here is not the period of the cosine in mm, but the number of periods over the lens' aperture. For a specific subaperture tool used in the asphere manufacturing process, smaller diameter aspheres will have less Strehl ratio degradation compared to larger diameter aspheres.
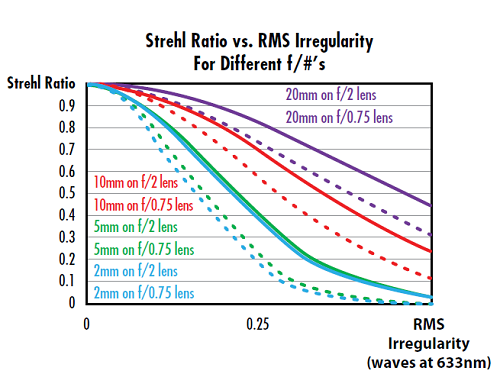
The f/# of the lens also impacts its surface irregularity. A general rule of thumb is that faster aspheres, or aspheres with smaller f/#’s, are more sensitive to surface irregularity’s impact on Strehl ratio. For example, Figure 5 compares an f/2, 25mm diameter lens to an f/0.75 lens with the same diameter, and more Strehl ratio degradation is observed in the faster lenses compared to the slower ones at a given cosine period.
Power Spectral Density and Irregularity Slope
The examples above demonstrate that the spatial frequency content of surface irregularity has a clear impact on the lens' Strehl ratio, and therefore real-world performance. In addition to RMS or peak-to-valley (PV) irregularity, additional specifications can be added to target these spatial frequencies.
Power spectral density (PSD) is a specification used to directly evaluate spatial frequencies.4 PSD describes surface irregularity as a function of spatial frequency and can be employed in a targeted way to limit the contribution from a range of spatial frequencies. PSD can also be used to simultaneously constrain all spatial frequencies.
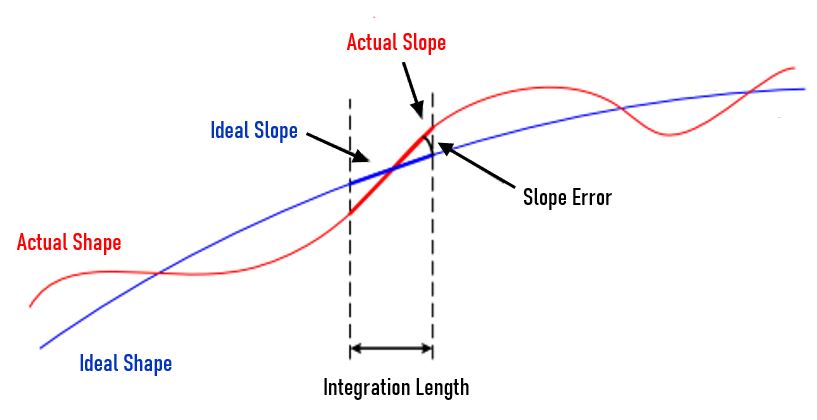
A simpler, yet still effective, method to reduce higher spatial frequencies in the surface irregularity structure is to constrain the slope of the cosine functions making up the irregularity map, in addition to the PV value. For a specific PV irregularity limit, higher slopes of the cosine functions are associated with higher spatial frequencies on the surface (Figure 6). Slope is commonly specified in terms of a maximum RMS slope value, which is a more comprehensive evaluation of the lens surface than a simple maximum slope requirement.5 A parameter called slope error is defined over a specified lateral distance called the integration length (Figure 7). The difference between the as-manufactured and ideal slopes is averaged over the integration length. For example, a slope specification may be given as "0.07 mrad over a 1mm integration length." Slope is defined as either the best linear fit to all data points in the integration length or simply the difference between the first and last points in the integration range.

The spatial frequency of surface irregularity on aspheric lenses has a significant impact on their Strehl ratio and real-world performance. The smaller the period, the more Strehl ratio degradation at a given surface irregularity. The shape of the lens’ surface irregularity map is required to understand the true impact of its surface irregularity on its performance, not just an irregularity specification by itself.7 Smaller f/#’s also lead to more degradation. When sourcing custom aspheres for your application, speak to your optical supplier to confirm that these relationships have been considered in the design of your lenses, whether they are custom made for you or off-the-shelf lenses. That will help make sure that your lenses perform as intended and your application meets its optical performance requirements.
References
- Strehl, Karl W. A. “Theory of the telescope due to the diffraction of light,” Leipzig, 1894.
- Mahajan, Virendra N. "Strehl ratio for primary aberrations in terms of their aberration variance." JOSA 73.6 (1983): 860-861.
- Smith, Warren J. Modern Optical Engineering. 4th ed., McGraw-Hill Education, 2007.
- Lawson, Janice K., et al. "Specification of optical components using the power spectral density function." Optical Manufacturing and Testing. Vol. 2536. International Society for Optics and Photonics, 1995.
- Messelink, Wilhelmus A., et al., "Mid-spatial frequency errors of mass-produced aspheres," Proc. SPIE 10829, Fifth European Seminar on Precision Optics Manufacturing, 7 Aug. 2018, doi:10.1117/12.2318663.
- Ceyhan, U. (2013). Characterization of aspherical lenses by experimental ray tracing [Doctor of Philosophy in Electrical Engineering thesis]. Jacobs University.
- Kasunic, Keith J., Laser Systems Engineering, SPIE Press, 2016. (ISBN 9781510604278)